Codetown
Codetown ::: a software developer's community
JavaFX 2.2 Canvas
One of the cool new features of the JavaFX 2.2 developer preview release is a new Canvas node that allows you to do free drawing within an area on the JavaFX scene similar to the HTML 5 Canvas. You can download this release for Windows, Mac, and Linux from JavaFX Developer Preview.
Being adventurous, I decided to take the JavaFX Canvas for a spin around the block. In doing some searching for cool HTML 5 Canvas examples, I came across Dirk Weber's blog comparing performance of HTML5 Canvas, SVG and Adobe Flash,An experiment: Canvas vs. SVG vs. Flash. This looked interesting for a Canvas beginner as I am, so I decided to copy his implementation and see how it runs in JavaFX.
This turned out to be pretty straight forward. Dirk's original JavaScript application for the HTML 5 Canvas contained a spirograph drawn at the top of the screen with 4 sliders beneath it for changing the number of rotations and particles and the inner and outer radius for the spirograph. Also, at the top is a text display showing the frames-per-second after the image is drawn. By manipulating the slider properties, the spirograph is drawn differently and each time the performance is shown in frames per second.
To do the same thing in JavaFX, I first created a JavaFX Application class, with a Stage and Scene and placed the Canvas at the top of the scene with 4 sliders below it followed by a Label to report the frames per second as defined in Dirk's original JavaScript implementation. One change I made to Dirk's implementation was instead of using Arrays of doubles for points, I used the JavaFX Point2D class.
My original goal was just to become familiar with the JavaFX Canvas object, but as I played around I noticed something about the performance. When I ran Dirk's HTML 5 and Flash version I would get a consistent frame-per-second rate of 50-70 fps when I adjusted the sliders (Mac OS X 10.7.4, 2.6 GHz Intel Core 2 Duo, 4 GB ram). However, when I ran my JavaFX version, the first time after starting, it drew the spirograph in the low 40s fps. But I noticed that when I adjusted the sliders, the performance got better. First adjustment, low 80s fps; fifth adjustment, mid 120s; a few more and I was getting 1000 fps, and eventually Infinity fps. I didn't believe the Infinity reading, so I debugged to the code, only to find out that it took less than a millisecond to calculate and draw the spirograph.
I assume that this behavior reflects the Hotspot compiler kicking in after a few iterations of the Spirograph calculation. But, it sure is fast.
The JavaFX source can be downloaded from here:
Comment
Happy 10th year, JCertif!
Notes
Welcome to Codetown!
 Codetown is a social network. It's got blogs, forums, groups, personal pages and more! You might think of Codetown as a funky camper van with lots of compartments for your stuff and a great multimedia system, too! Best of all, Codetown has room for all of your friends.
Created by Michael Levin Dec 18, 2008 at 6:56pm. Last updated by Michael Levin May 4, 2018.
Looking for Jobs or Staff?
Check out the Codetown Jobs group.
InfoQ Reading List
AWS Introduces Amazon S3 Annotations

AWS recently announced Amazon S3 Annotations, a feature that lets teams attach rich, searchable context such as summaries, classifications, compliance data, or AI-generated insights directly to S3 objects. Annotations can be updated independently of the object and queried across datasets, reducing the need for separate metadata systems.
By Renato LosioClaude Reaches GA on Microsoft Foundry: European Enterprises Cannot Deploy It

Claude models reached GA on Microsoft Foundry with Azure-native billing and governance, but no European data zone exists. Anthropic's own documentation confirms data residency guarantees apply to Bedrock and Vertex AI but not Foundry. European practitioners from banking and healthcare report the offering is unapproved for production.
By Steef-Jan WiggersCycle Introduces EU Control Plane as Sovereignty Debate Continues

Cycle recently introduced a separate EU-based control plane, allowing European customers to keep platform management data and telemetry within Europe. The new offering is designed to improve compliance, operational isolation, and responsiveness for European organizations.
By Renato LosioCloudflare Details Unified Data Platform Where Billing Workloads Account for 53% of Queries
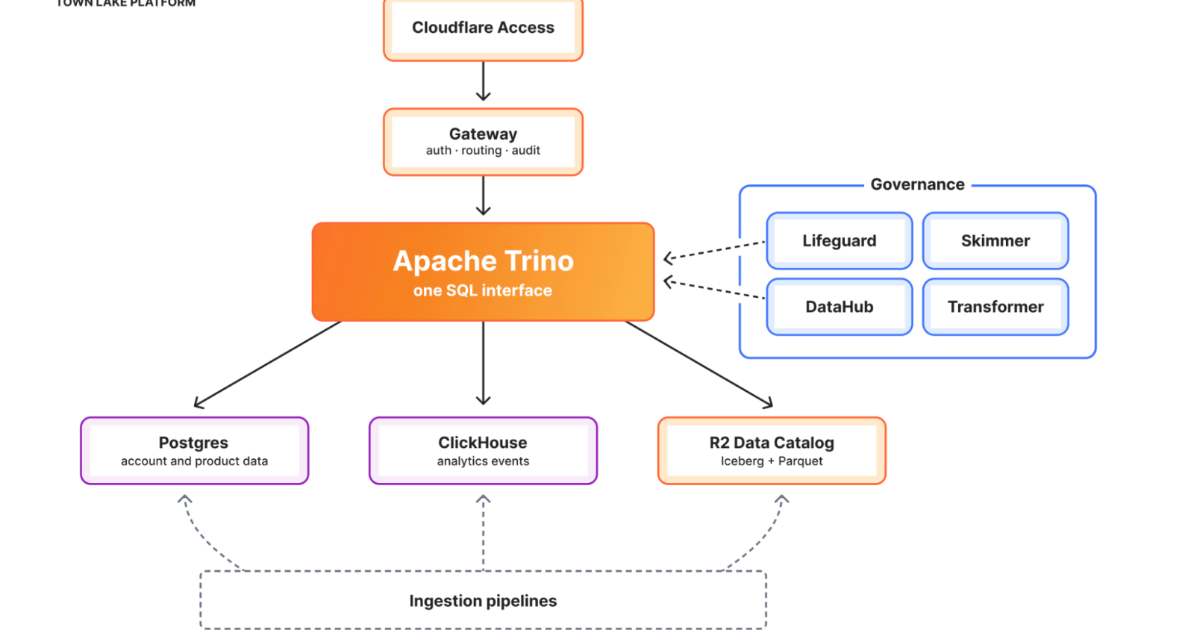
Cloudflare details Town Lake, an internal unified data platform, and Skipper, an AI analytics agent unifying access to operational, billing, security, and business data. The platform processed ~91K billing queries, with billing forming majority usage. Built on a lakehouse architecture using Trino, Iceberg, R2, and DataHub, it enables governed cross-system analytics and natural language access.
By Leela KumiliHardwood Promises High-Speed JVM Apache Parquet Processing with Zero Mandatory Dependencies
Hardwood, the project Gunnar Morling kick-started to improve the handling of Parquet files in Java, reached version 1. Its multi-threaded approach and zero mandatory external dependencies promise a simpler, optimal alternative to the Apache Parquet Java implementation. For now, the library provides a reading via API and a CLI for visualisation; writing support is expected in the upcoming versions.
By Olimpiu Pop
© 2026 Created by Michael Levin.
Powered by
![]()
You need to be a member of Codetown to add comments!
Join Codetown